Histograms in photography may look scary at first.
Many photographers don’t want to consider it all that much when taking a photograph. But I promise that this simple tool can elevate your photography.
And once you learn how to take advantage of it, you’ll never go back.
What is a Histogram in Photography?
Let’s define histograms in photography!
First, there are two types: luminosity histogram (the one we’ll mainly cover) and color histogram. Some editing programs like Adobe Photoshop have a single histogram for both color and luminosity.
A luminosity histogram in photography is a graphical representation of the tonal range of an image. It is a chart that shows the distribution of brightness values in an image, from the darkest shadows to the brightest highlights.
The horizontal axis of the histogram represents the tonal range of the image, from black to white, while the vertical axis represents the number of pixels in the image that have a particular brightness value.

Histograms are helpful tools for photographers because they allow you to evaluate the exposure of an image and adjust it accordingly. A well-exposed picture will have a histogram evenly distributed across the tonal range.
By using the histogram, photographers can adjust their exposure settings, such as aperture, shutter speed, and ISO, to ensure that the image is exposed correctly and retains detail in both the shadows and highlights.
How to Read a Histogram: Understanding the Basics
Reading the histogram is the first step to understanding it. So what does a histogram show in photography?
A histogram is a visual tool used to display the distribution of tones in an image. The image’s tones are arranged on a horizontal axis from black on the left to white on the right, while the frequency or number of pixels in each tone is represented on the vertical axis.
In other words, a histogram shows how many pixels are present in each brightness level of an image.
Darker areas of the image will appear on the left side of the histogram and brighter areas on the right side, with mid-tones in between.
Free Lightroom Course for Parents. Create Natural, Professional Family Photos
Learn how to make your family photos bright, natural, and frame-worthy, even if you’re brand new to Lightroom.
What is a color histogram?
An RGB histogram in photography shows an image’s distribution of red, green, and blue color channels. A separate diagram in the histogram represents each color channel.
When two or more color channels overlap, they create new colors.
For example, when red and green overlap, they make yellow. The gray diagram in the histogram shows where all three color channels overlap, creating shades of gray. The yellow, cyan, and magenta diagrams show where two color channels overlap, creating new colors.
Color histograms guide you in changing the image as needed based on their color analysis. For example, if you notice a spike in the red channel, you may want to adjust the color balance to reduce the amount of red in the image.
Where can you find the histogram?
- On the back of your camera screen
- In your post-processing software
How to see and use histograms in Lightroom?

- Go to the Develop module.
- Click on the “Histogram” panel on the right-hand side of the screen.
The histogram will show a graphical representation of the image’s tonal distribution.
Using Histograms to Evaluate Exposure: Overexposure vs. Underexposure
What is clipping?
When the histogram chart shows a concentration of pixels at either end, it means that those areas are overexposed (too bright) or underexposed (too dark).
The more pixels that are concentrated at the far ends of the histogram, the more the image is affected by what is called clipping.
To tie this with what I said earlier, clipping in an image means that the camera may not capture the full range of brightness, resulting in areas that appear entirely white or black in the photo.
When evaluating exposure using a histogram, you want to ensure that the bulk of the histogram is in the mid-tones, with some highlights and shadows on either end. That’s the only way to avoid unintentional black or white clipping.
Let’s consider the deviations and see what they look like:
Underexposure
When an image is underexposed, it’s darker than it should be, resulting in lost details in the shadows.

You can see this in the histogram, which shows that most of the pixels are skewed to the left side, indicating that the image is underexposed.
The left peak in the histogram represents the pure black area, which means that parts of the image are clipped or lost.
Overexposure
On the other hand, when an image is overexposed, it’s too bright, resulting in pure white or 100% bright areas. The histogram will show that most pixels are on the right side, indicating the image is overexposed.
The right peak in the histogram represents the pure white area, which means that parts of the image are clipped.

There are ways around these over or underexposure issues. After checking the histogram, you can:
- Adjust the camera settings, such as the shutter speed, ISO, or aperture, to increase the exposure and avoid clipping.
- Use exposure compensation if using a different mode (like aperture or shutter-speed priority)
- Shoot in RAW format and bring back some details when editing your photo in your image editing software.
Correct exposure
A correctly exposed image will have a histogram showing a distribution of tones that covers the full range from shadows to highlights without clipping on either end of the histogram.
The histogram should show a bell-shaped curve, with most data falling in the middle of the range.

How can you fix an overexposed or underexposed image in your editing software:
- Use the exposure slider: You can use the exposure slider in the Basic panel to adjust the image’s overall brightness. Move the slider to the left to darken the image and to the right to brighten it.
- Use curves: You can use the curves tool to adjust the exposure of specific image areas. Create a new point on the curve by clicking and dragging, then adjust the point up or down to brighten or darken the area.
- Use other adjustment tools: Lightroom offers many different tools for adjusting exposure, such as the highlight and shadow sliders, the tone curve, and the white balance adjustments.
Histograms – Variations From the Norm
If the histogram shows most of the tones are in the middle portion, then the photo is likely properly exposed, right? Well, this isn’t always the case. I think that there are situations where a skewed curve is actually desirable!
Low-key photography
For instance, imagine a photograph of a subject with a dark background, where a single light source illuminates the subject.
The resulting image may have a histogram heavily weighted towards the dark end, with very little information in the mid-tones or highlights.
However, this could be the intended effect, as the high contrast and low-key lighting create a dramatic and moody atmosphere.

High-key photography
If we look at the histogram for this picture, there are a lot of light colors and not many dark colors. High-key images are characterized by their bright, airy, and luminous appearance.
And if we look at the histogram, we can see little detail in the shadows, which matches the picture.
If we tried to make the histogram look more “adequate” by darkening some areas, we would make the picture worse and ruin the feeling it conveys.

Night photography
When taking photos at night, the histogram should lean more towards the left side of the middle, indicating more dark tones in the image than bright ones.

Bright photos
If you take photos of a bright beach with lots of sunlight, a good histogram will show a bias towards the right side. The image will have many bright tones, and the histogram will reflect this. That’s perfectly fine as long as it accurately reflects the scene.
Another example: let’s say you’re taking a picture of some white socks, and the photo has a lot of bright tones in the background. In this case, the histogram may be skewed towards the right, making it look overexposed.
But if you adjust the exposure settings to make the histogram look “good,” the picture might end up underexposed.
Histograms and contrast
There is another element you can read in a histogram: contrast.

When figuring out how to read a camera histogram, look for contrast!
A lower-contrast image will have a histogram with most tones concentrated around the center. This means fewer differences in brightness between the darkest and lightest parts of the image, resulting in a more evenly balanced distribution.
In contrast, a higher-contrast image will have a histogram with a broader distribution of tones and higher peaks on the sides. This is because more significant brightness differences exist between the image’s darkest and lightest parts.
Now that you’ve seen these examples, you may wonder: what does a histogram do in photography?
It’s important to know that a histogram is just a tool showing your photo’s brightness levels. It’s not necessarily good or bad.
Depending on the scene and your artistic vision, a histogram that looks “bad” might actually be the correct exposure for the photo you want to take.
Sharpen Your Photography Skills in One Afternoon
Download my free guide with 10 expert techniques that took me years to master. You’ll discover the simple shifts that separate amateur shots from frame-worthy photos.
Join 300+ photographers already leveling up their skills
Histogram FAQs
What is a histogram used for?
We’ve seen some situations where a “wrong” histogram may be desired. So when should you actually use a histogram? How to use histograms in photography?
The key is to use it to avoid losing essential details in the highlights or shadows, not necessarily to get the perfect bell curve.
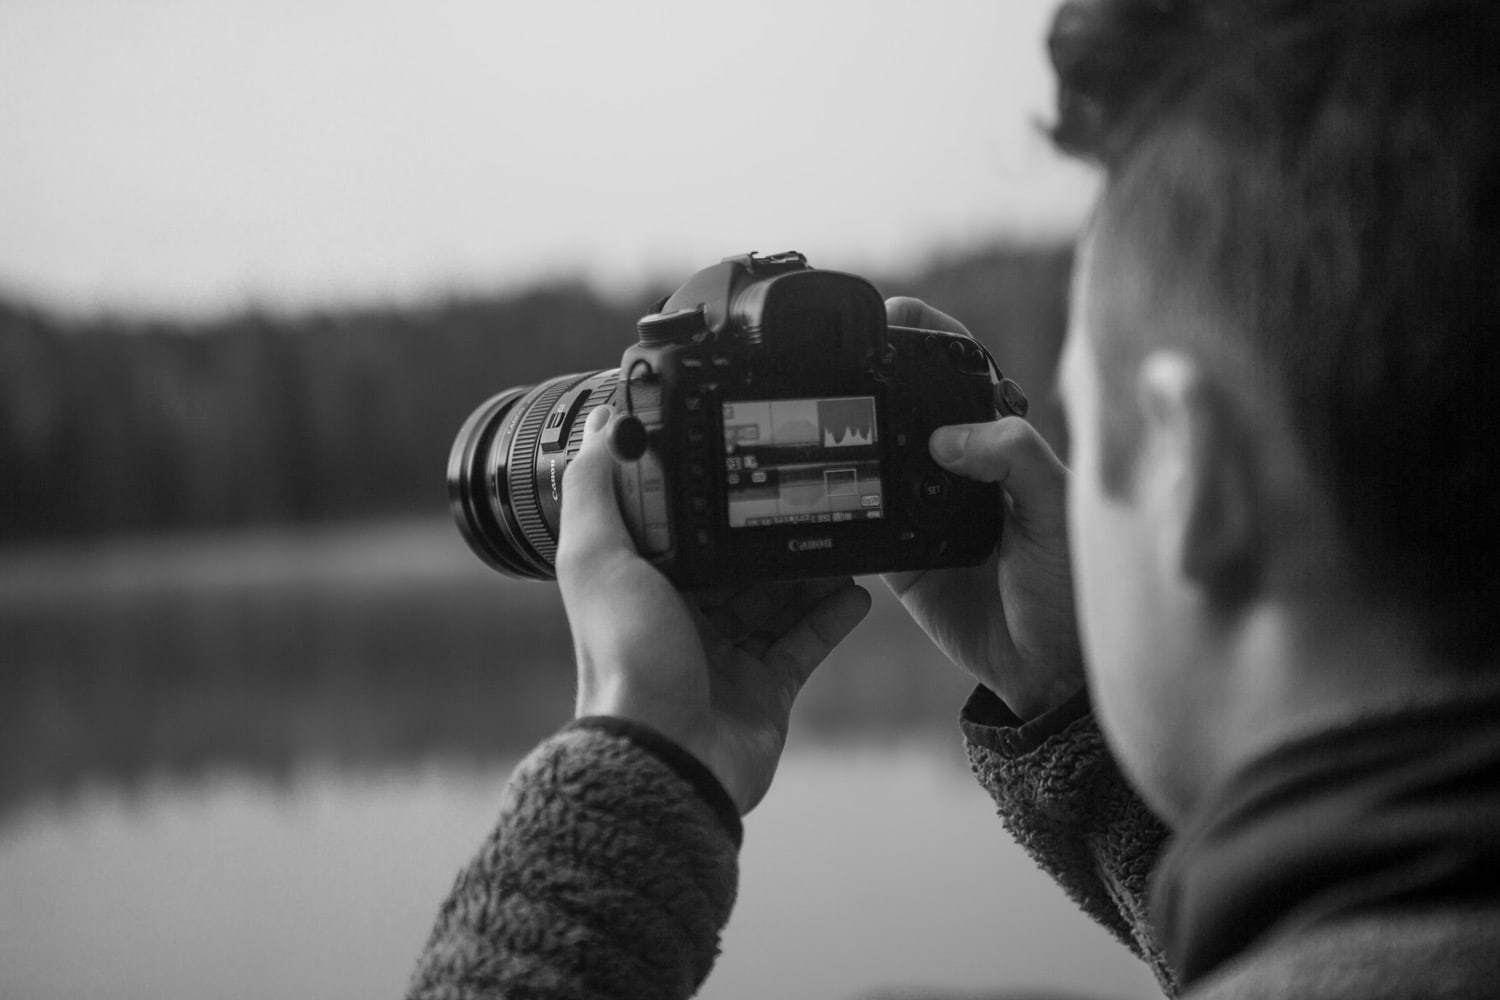
Another important use is when taking a picture with your digital camera. You can look at the histogram to see how bright or dark the photo turned out. Don’t always rely on the camera screen, as it may not be accurate.

What are the advantages of histograms in image processing?
Histograms are an essential tool in image processing because they allow you to analyze the tonal distribution of an image. Here are the situations in which using a histogram is helpful in editing:
Adjusting exposure: If the histogram lacks detail in the shadows, adjust the exposure to brighten the image. Conversely, if the histogram lacks detail in the highlights, reduce the exposure to darken the image.
Adjusting contrast: If the histogram lacks contrast, you can adjust the contrast to bring out more detail. You can do this by increasing the difference between the dark and light areas of the image.
Adjusting color balance: If the colors in the image appear off, you can use the histogram to identify which colors are dominant.
For example, if the histogram shows a spike in the red channel, you can adjust the color balance to reduce the red and bring out more of the other colors.
What is the correct way to make a histogram?
There is no correct way; it depends on what you want to convey or photograph.
Certain creative choices in photography, such as intentionally under or overexposing an image, may result in a histogram that does not follow the typical bell-shaped curve. High-key or low-key photos have histograms that deviate from the norm.
Ultimately, the quality of a photo depends on many factors beyond just its histogram, such as composition, lighting, subject matter, and emotional impact. While a well-exposed photo can undoubtedly contribute to the overall quality of an image, it is not the only factor determining whether a photograph is considered “good.”
PRO Tips
- Keep in mind that what you see on the camera’s LCD screen may not accurately represent the actual image. To ensure that your photos are correctly exposed, I recommend using the histogram feature rather than relying solely on the image preview, as it is more accurate.
- When taking photos using the live histogram feature, I suggest you carry extra batteries. That’s because it is a battery-draining feature.
What is Histogram in Photography: Final Thoughts
Understanding histograms in photography (like how to read a histogram chart and what is a histogram used for in photography), allows photographers to quickly analyze the image after taking it and decide whether to retake it to avoid exposure errors.
Additionally, histograms are useful in post-processing to adjust exposure, contrast, and color accuracy by identifying the problematic areas in the image and making subtle adjustments.
However, it’s important to remember that a histogram will not solve all your exposure issues alone. It may even hinder creativity. With this in mind, use it as a guide to get the most out of any photographic situation and get all that sweet detail in your lights or shadows.
And if you need to know more to get out there and shoot as many photos as possible, check out our other articles here on OHMYCAMERA.